

Q. What attribution models does GA4 have, and which should you trust, first touch or last touch?
Only two branches of attribution model remain in GA4: data-driven attribution (DDA, the default since the second-half-2023 overhaul) and the last-click family. The four models, first click, linear, time decay, and position-based, have been retired. First touch and last touch aren't competing for the same right answer, they're playing different roles, one showing which channel got you discovered, the other which channel closed the deal.
Three lines you can use today
- Open the Model comparison report and see for yourself how channel rankings differ between last-click and data-driven.
- Open the User acquisition and Traffic acquisition reports for the same date range side by side and compare the top channel.
- Check the key event lookback window settings (30 days for acquisition events, 90 days for everything else) in Admin.
Two Reports, Two Different #1 Channels
A scene that plays out often in marketing meetings. One person opens the GA4 User acquisition report and says, "Organic search is #1 this month." The person next to them opens the Traffic acquisition report, and the #1 channel there is paid social.
Same account, same date range, even numbers pulled by the same person. Yet the channel sitting at the top of the ranking is different. The meeting pauses for a second, and someone asks, "Is the report broken?"
The report isn't wrong. The two reports were simply picking "#1" by different criteria all along. This post walks through that difference in criteria, and then why attribution models, working on top of that, exist and what question they actually answer.
The answer up front: this isn't a matter of picking first touch or last touch as the correct one. To see why, start with scope, the unit that groups the data.
Attribution Is About Distributing Credit
Start with Google's official definition. Attribution is "the practice of assigning credit to the various ads, clicks, and factors that a user encountered on the way to completing a meaningful action (a conversion)." That's the sentence straight from the official GA4 Help Center.
If "assigning credit" sounds abstract, think of soccer. The player who scores the winning goal gets the spotlight, but without the player who threaded the pass through the defense before that, there's no goal. Multiple players (touchpoints) are involved in a single goal (conversion).
The last-click model hands all the credit to the player who scored. The first-click model, which used to exist, went the other way, giving it all to whoever made the very first pass. Both are the same kind of simplification, all the credit dumped on one person.
Data-driven attribution (DDA) is closer to calculating the whole match's sequence of passes and splitting credit by actual involvement. We'll come back to exactly how it splits things up later.
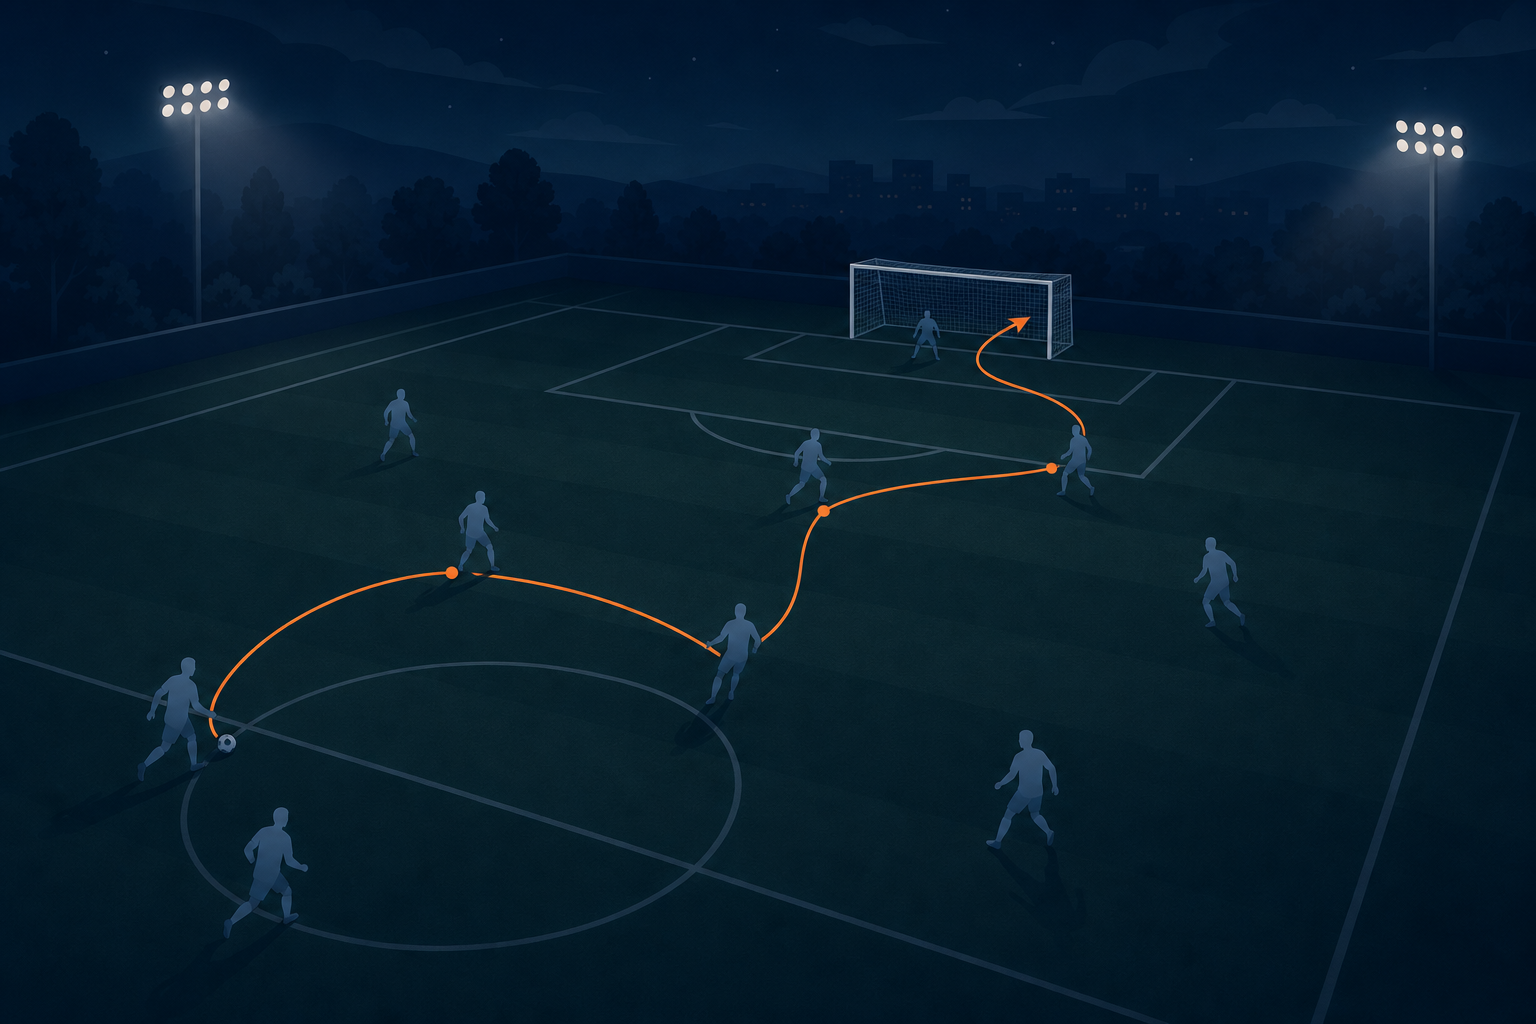
Image: only the scorer gets the spotlight, but without the players who moved the ball there first, there's no goal.
Slicing the Same Journey Three Ways: User, Session, and Event Scope
The meeting-room scene from earlier comes down to a difference in scope. GA4 slices the same journey into three different units.
First user source/medium is scoped to the person. It records, once, the channel that first brought a user to your site or app, and that value never changes no matter how many sessions follow. You see this in the User acquisition report.
Session source/medium is scoped to the visit. It re-records the channel at that moment every time a new session opens, so even the same person can show a different value on each visit. You see this in the Traffic acquisition report.
Let's unpack the meeting-room scene through scope. Say organic search first brought a user in, and later that person came back after seeing a paid social ad. The User acquisition report still counts this person under organic search. The Traffic acquisition report counts this session under paid social. Both reports are correct, they're just counting in different units.
One trap in practice is mixing the two into a single table. GA4's official Help Center is explicit that you shouldn't mix metrics from the two scopes. Sessions can't be queried alongside a first-user scope dimension, and first user source needs to pair with first user default channel group, while session source needs to pair with session default channel group.
The third is event scope. Every time a conversion event fires, the attribution model is the layer that calculates how to split credit across the touchpoint history leading up to it (up to 50 touchpoints within the lookback window). If scope is the dimension that records "where did this come from," the model is the logic that calculates "how much credit does each of those records get," a difference in hierarchy.
That said, I couldn't find a single official page that defines all three scopes side by side. What's laid out here is cross-checked across multiple sources, so I'd recommend a final check against your own account's User acquisition and Traffic acquisition report help pages.
The two reports from the meeting room were the same journey sliced by user scope and session scope respectively. Event scope is one more layer on top, calculating credit.
The Models That Disappeared: Why First Click, Linear, and Time Decay Are Gone
In the second half of 2023, Google retired four rule-based models: first click, linear, time decay, and position-based. All four split credit mechanically according to rules a person had set in advance.
The exact removal date is recorded slightly differently across sources. Starting in May 2023, these four models could no longer be selected for new GA4 conversion actions, Google officially announced the sunset in September, and sources differ on whether full removal happened in September or mid-October. So this post notes only "second half of 2023" rather than a specific day.
Existing conversion actions that used these four models were automatically switched over to data-driven attribution, with the option to manually switch to last click instead. The choices remaining in GA4 today are data-driven attribution and last click for paid and organic channels combined, and a Google-paid-channels-only last click.
One trap in practice: old GA4 tutorials and screenshots still floating around the internet still show those four models as options. Those are pre-2023 screens, so if you don't see them in your account now, nothing is wrong.
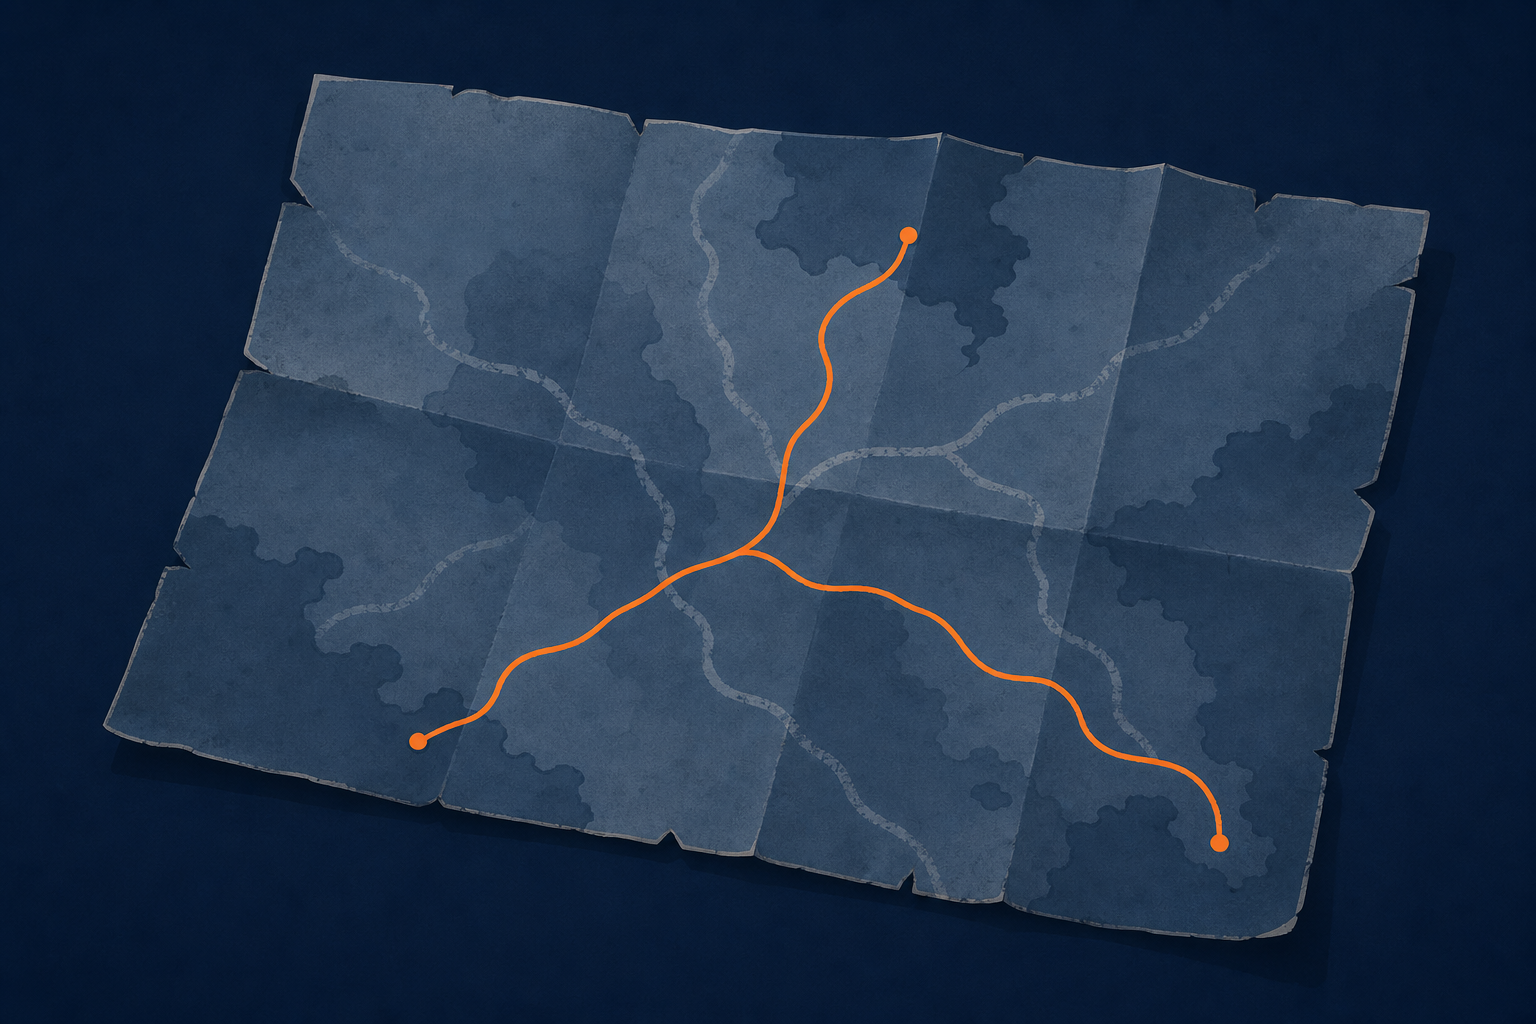
Image: the four rule-based paths have been erased. Only two paths remain on today's GA4 map.
Data-Driven Attribution: Credit Split by a Machine
Data-driven attribution (DDA) is GA4's current default. Instead of pre-setting rules, it uses machine learning to compare that account's own converting and non-converting paths, calculating how much each click or impression actually contributed to conversion.
It factors in variables like time remaining until conversion, device type, number of ad impressions, impression order, and creative type. It works by comparing paths where a particular channel shows up disproportionately in the last slot right before conversion against paths that converted similarly without that channel, estimating actual incremental contribution.
But it's a black box. The calculation comes out differently for every account, and the exact reasoning for why a given channel got a particular weight isn't visible anywhere in the interface. Comparing your account's DDA weights directly against another account's is meaningless too, since each is a result trained on its own data.
So in practice, it's safer to use DDA as a reference point compared side by side against models like last click, rather than treating it as the definitive number. We'll come back to how to compare them later.

Image: it's calculation, not rules. We just can't see exactly what the calculation is.
Credit Has a Deadline Too: The Key Event Lookback Window
No matter how sophisticated an attribution model is, it shouldn't credit touchpoints infinitely far in the past. If an ad seen six months ago keeps getting counted as influencing today's conversion, that just adds noise to judging recent campaign performance. So GA4 sets a time range within which a touchpoint can receive conversion credit, the key event lookback window.
Acquisition events (first install, first visit) default to 30 days and can only be shortened to 7. Most other key conversion events default to 90 days and can be adjusted to 30 or 60. Engaged-view events default to 3 days. These values apply uniformly across every attribution model and session attribution.
Two traps in practice. First, it's easy to mistake this as extendable, but acquisition events can't be increased past 30 days, only shortened to 7. Second, changing the lookback window setting doesn't apply retroactively to past data, it only takes effect from the point of the change forward.
If your industry has a long sales cycle, the 90-day default might be shorter than your actual buying journey. Start by checking in Admin whether this value matches your business's real consideration period.
Impressions outside the lookback window are excluded from credit calculation entirely. Widen or narrow the window, and it takes effect starting with the next data.
So What Should You Trust: A Model Isn't an Answer, It's a Perspective
By now the answer should be coming into view. First touch and last touch aren't competing for the same correct answer, they're perspectives playing different roles. First touch shows you the channel that first got this person to discover you, last touch shows you the channel that landed the final blow right before conversion.
Google itself acknowledges this difference in perspective as a product feature. The Model comparison report in the Attribution section lets you place up to three models (last click, first click, and data-driven, for example) side by side and see directly how the same channel's credit allocation shifts across models. Google has effectively proven, with a single report, that the same click data can shuffle channel performance rankings just by changing the model.
The exact navigation path and naming of this report were compiled from documentation rather than re-verified against live screenshots, so it's worth opening it in your own account to confirm where it lives.
In practice, this means attaching a different KPI to each channel. Channels wearing the "discovery" badge (organic content, awareness ads, and so on) get evaluated on awareness metrics like new users or reach, channels wearing the "closer" badge (retargeting, branded search, and so on) get evaluated on conversions and conversion rate. Pull budget from a channel because one model's numbers say it's not needed, and you may have simply misunderstood the role that channel was playing.
Before you cut a channel, check whether it's wearing the discovery badge or the closing badge first.
What Lies Outside This Report
Everything up to this point has been within the data GA4 records through clicks and sessions. But an attribution model can only ever split credit among clicks that got recorded. Awareness paths that leave no click at all, word of mouth or product placement, for instance, where a brand gets imprinted without an ad click and later converts through a direct search or direct visit, sit entirely outside what this model can calculate. How to handle this blind spot is covered separately in Dark Funnel Tracking.
There's also an illusion where conversions coming through branded search get read as that channel's own performance. Branded search is just the channel where demand gets harvested, the first-touch record alone can't capture what the real cause upstream actually was. A framework that separates the ledger (confirmed attribution) from estimation (allocation based on aggregate signals) continues in the deep-dive post.

Image: the conversations and screens in the fog leave no click behind. That doesn't mean they didn't happen.
What to Check Today
You've now gone through models, scope, and the lookback window in order. One thing remains: open the screen and check it yourself.

Image: only three things to do today: open it, put it side by side, and compare it yourself.
- Model comparison: how different are the channel rankings between last click and data-driven? Open the Model comparison report under Attribution and check for yourself.
- Scope cross-tab: is the #1 channel in User acquisition the same as in Traffic acquisition, or different? Open both reports for the same date range and check.
- Lookback window: does 30 days for acquisition events and 90 for everything else match your sales cycle? Check the actual setting under Data settings in Admin.
If you take away just one thing, let it be this.
A model doesn't give you an answer, it gives you a perspective. Don't set your budget by looking at just one perspective.
Frequently Asked Questions
What attribution models does GA4 have?
Only two branches of attribution model remain in GA4: data-driven attribution (DDA, the default since the second-half-2023 overhaul) and the last-click family. The four models, first click, linear, time decay, and position-based, have been retired. First touch and last touch aren't competing for the same right answer, they're playing different roles, one showing which channel got you discovered, the other which channel closed the deal.
Why do first user source and session source come out different?
The User acquisition report is user-scoped, counting once and for good the channel that first brought a user in. The Traffic acquisition report is session-scoped, re-counting the channel at that moment every time a session opens. If the same person first came in through organic search and later returns after seeing a paid social ad, User acquisition still counts them under organic search while Traffic acquisition counts that session under paid social. Both numbers are correct, they're just counting in different units.
Can you trust data-driven attribution?
It's not fully transparent, but it's not baseless calculation either. DDA uses machine learning to compare that account's own converting and non-converting paths and estimate each touchpoint's actual contribution, and it's GA4's current default. But since the reasoning behind it is a black box you can't see in the interface, it's safer to make a habit of cross-checking it against other models like last click in the Model comparison report.
This post is Part 8 of the Digital Marketing Analytics Basics series. Having covered GA4's standard reports and the limits of the dark funnel, you now also have how credit gets calculated on top of that data.
- Previous: Getting Started with GA4, Dark Funnel Tracking
- Next: Ad Effectiveness, Lift and Adstock
- Deep dive: Branded Search Attribution
The trap in reading attribution models applies to off-site journeys too. The tracking links and MMP piece covers what gets overstated when a stitched path is called an individual journey.
Sources
- Official attribution definition: [GA4] Attribution, Google Help Center
- Model list and DDA default: Get started with attribution, Google Help Center
- Model retirement, supplementary: Attribution models, Google Help Center
- Retirement timing cross-check: Google confirms sunset date for attribution models in Ads and GA4, Search Engine Land
- Key event lookback window defaults: Change the key event lookback window, Google Help Center
- Scope distinction, supplementary (unofficial, secondary cross-check): GA4 scopes guide: first user vs. session, DashThis
- Model comparison report, supplementary (unofficial): GA4 Model comparison report in Attribution, OptimizeSmart
This post opens with an anonymized, composite practitioner scene, no specific company or channel names. The three-way scope distinction and the exact navigation path for the Model comparison report couldn't be fully confirmed against primary official documentation, so they were cross-checked against secondary sources. The exact removal date for the retired models is also recorded differently across sources, so it's noted here only as the second half of 2023.
Found this useful? Share it
Latest posts
Kakao Share Thumbnail Not Showing? Here's the Fix (JavaScript SDK 2025)
Learn why Kakao Share thumbnails don't appear even with a valid imageUrl, and fix it using scrapImage to convert your URL into a KAGE CDN URL. Step-by-step guide.
How to Generate CRM User Manuals in 20 Minutes with Claude Code Sub-Agents
Learn how Claude Code sub-agents can analyze your CRM codebase and auto-generate user manuals and visual guidebooks in just 20 minutes. See the real-world results.
GEO Generative Engine Optimization: The Complete 2025 AI Marketing Strategy Guide
Learn what GEO (Generative Engine Optimization) is, how it differs from traditional SEO, and discover 5 proven AI marketing strategies to get cited by AI search engines in 2025.
Related projects
Get new posts by email
Insights on marketing, analytics, and dev, delivered to your inbox.