
What is benchmarking? It is the practice of putting the methods and results of competitors or industry leaders next to your own, then analyzing the gap to find what you should change. The Standard Korean Language Dictionary, published by Korea's National Institute of Korean Language (entry), defines it as "closely analyzing a competitor's management methods in order to catch up with that competitor, or a strategy of doing so." Marketers usually do three things. They compare their site numbers with an industry baseline, open competitors' ads to see what they run, and learn the work process of teams that do it well. The reference date is November 14, 2026.
What is benchmarking: how is copying different from comparing to learn
Benchmarking starts with one question: where is the standard I should compare myself to? The standard can be another team in the same organization, another company in the same industry, or a best practice from a completely different industry. What you compare falls into numbers (performance), work steps (process), and the way others compete (strategy). The Wikipedia entry Benchmarking presents these three as the core types. It also calls comparison inside one organization internal benchmarking and comparison with other organizations external benchmarking.
| Basis | Type | What you compare | Marketing example |
|---|---|---|---|
| What you compare | Performance benchmarking | Quantitative metrics | Your bounce rate vs. the median bounce rate in your industry |
| Process (practice) benchmarking | How the work is done | The ad sequence a competitor uses to announce a new product | |
| Strategy benchmarking | How other companies compete | Why a competitor leads with service quality instead of price | |
| Who you compare with | Internal benchmarking | Teams or campaigns in the same organization | Last quarter's best ad creative vs. this quarter's creative |
| External benchmarking | Other organizations | Average engagement time of sites in the same industry |
A four-way split into performance, practice, internal and external also appears in the benchmarking types article from APQC, a quality and productivity research organization. Wikipedia notes that in 1989 Robert Camp published one of the early books on benchmarking, which set out a 12-step methodology.
The difference between copying and benchmarking is in the output. Taking a competitor's ad copy as is counts as imitation. Finding out why the competitor uses that copy and adapting it to your own customers counts as benchmarking. Imitation copies without comparing. Benchmarking records the differences, looks for reasons, and leads to an experiment that fits your situation.
Marketers benchmark with three data sources and official tools
The three tools point at different things. For comparing numbers, use GA4 benchmarking. For seeing which ads a competitor runs, use the Ads Transparency Center and the Meta Ad Library.
| Tool | What it compares | What you can see | What you cannot see | Official docs |
|---|---|---|---|---|
| GA4 benchmarking | A peer group in the same industry category | Median, 25th and 75th percentile range, and your own trend line | Numbers for one specific competitor, individual companies | Analytics Help: Benchmarking |
| Google Ads Transparency Center | Individual advertisers found by advertiser name or website | Ad creative preview, advertiser name, verification badge, region, last shown date, format | Spend on ordinary commercial ads | Ads Transparency Center FAQ |
| Meta Ad Library | Individual advertisers found by word, name or page | Creative and text of active ads, the page running them, start date | Spend on ordinary active ads | About the Meta Ad Library |
An industry baseline tells you whether you are slow or fast. Competitor ad tools tell you what they say and how they say it. If you mix the two to guess the performance of one competitor, the conclusion has no basis.
GA4 benchmarking compares your site numbers with your industry
GA4 benchmarking shows your property's metrics next to a peer group in the same industry category. According to the Analytics Help Center, the baselines are given as the median, the 25th percentile and the 75th percentile, and the group is set by the industry category assigned to your property. The default category is decided by combining signals such as the industry you picked during setup, the property's URL and the app ID of the data stream. If you change the category and subcategory in the benchmarking details, it applies to all benchmarking data.
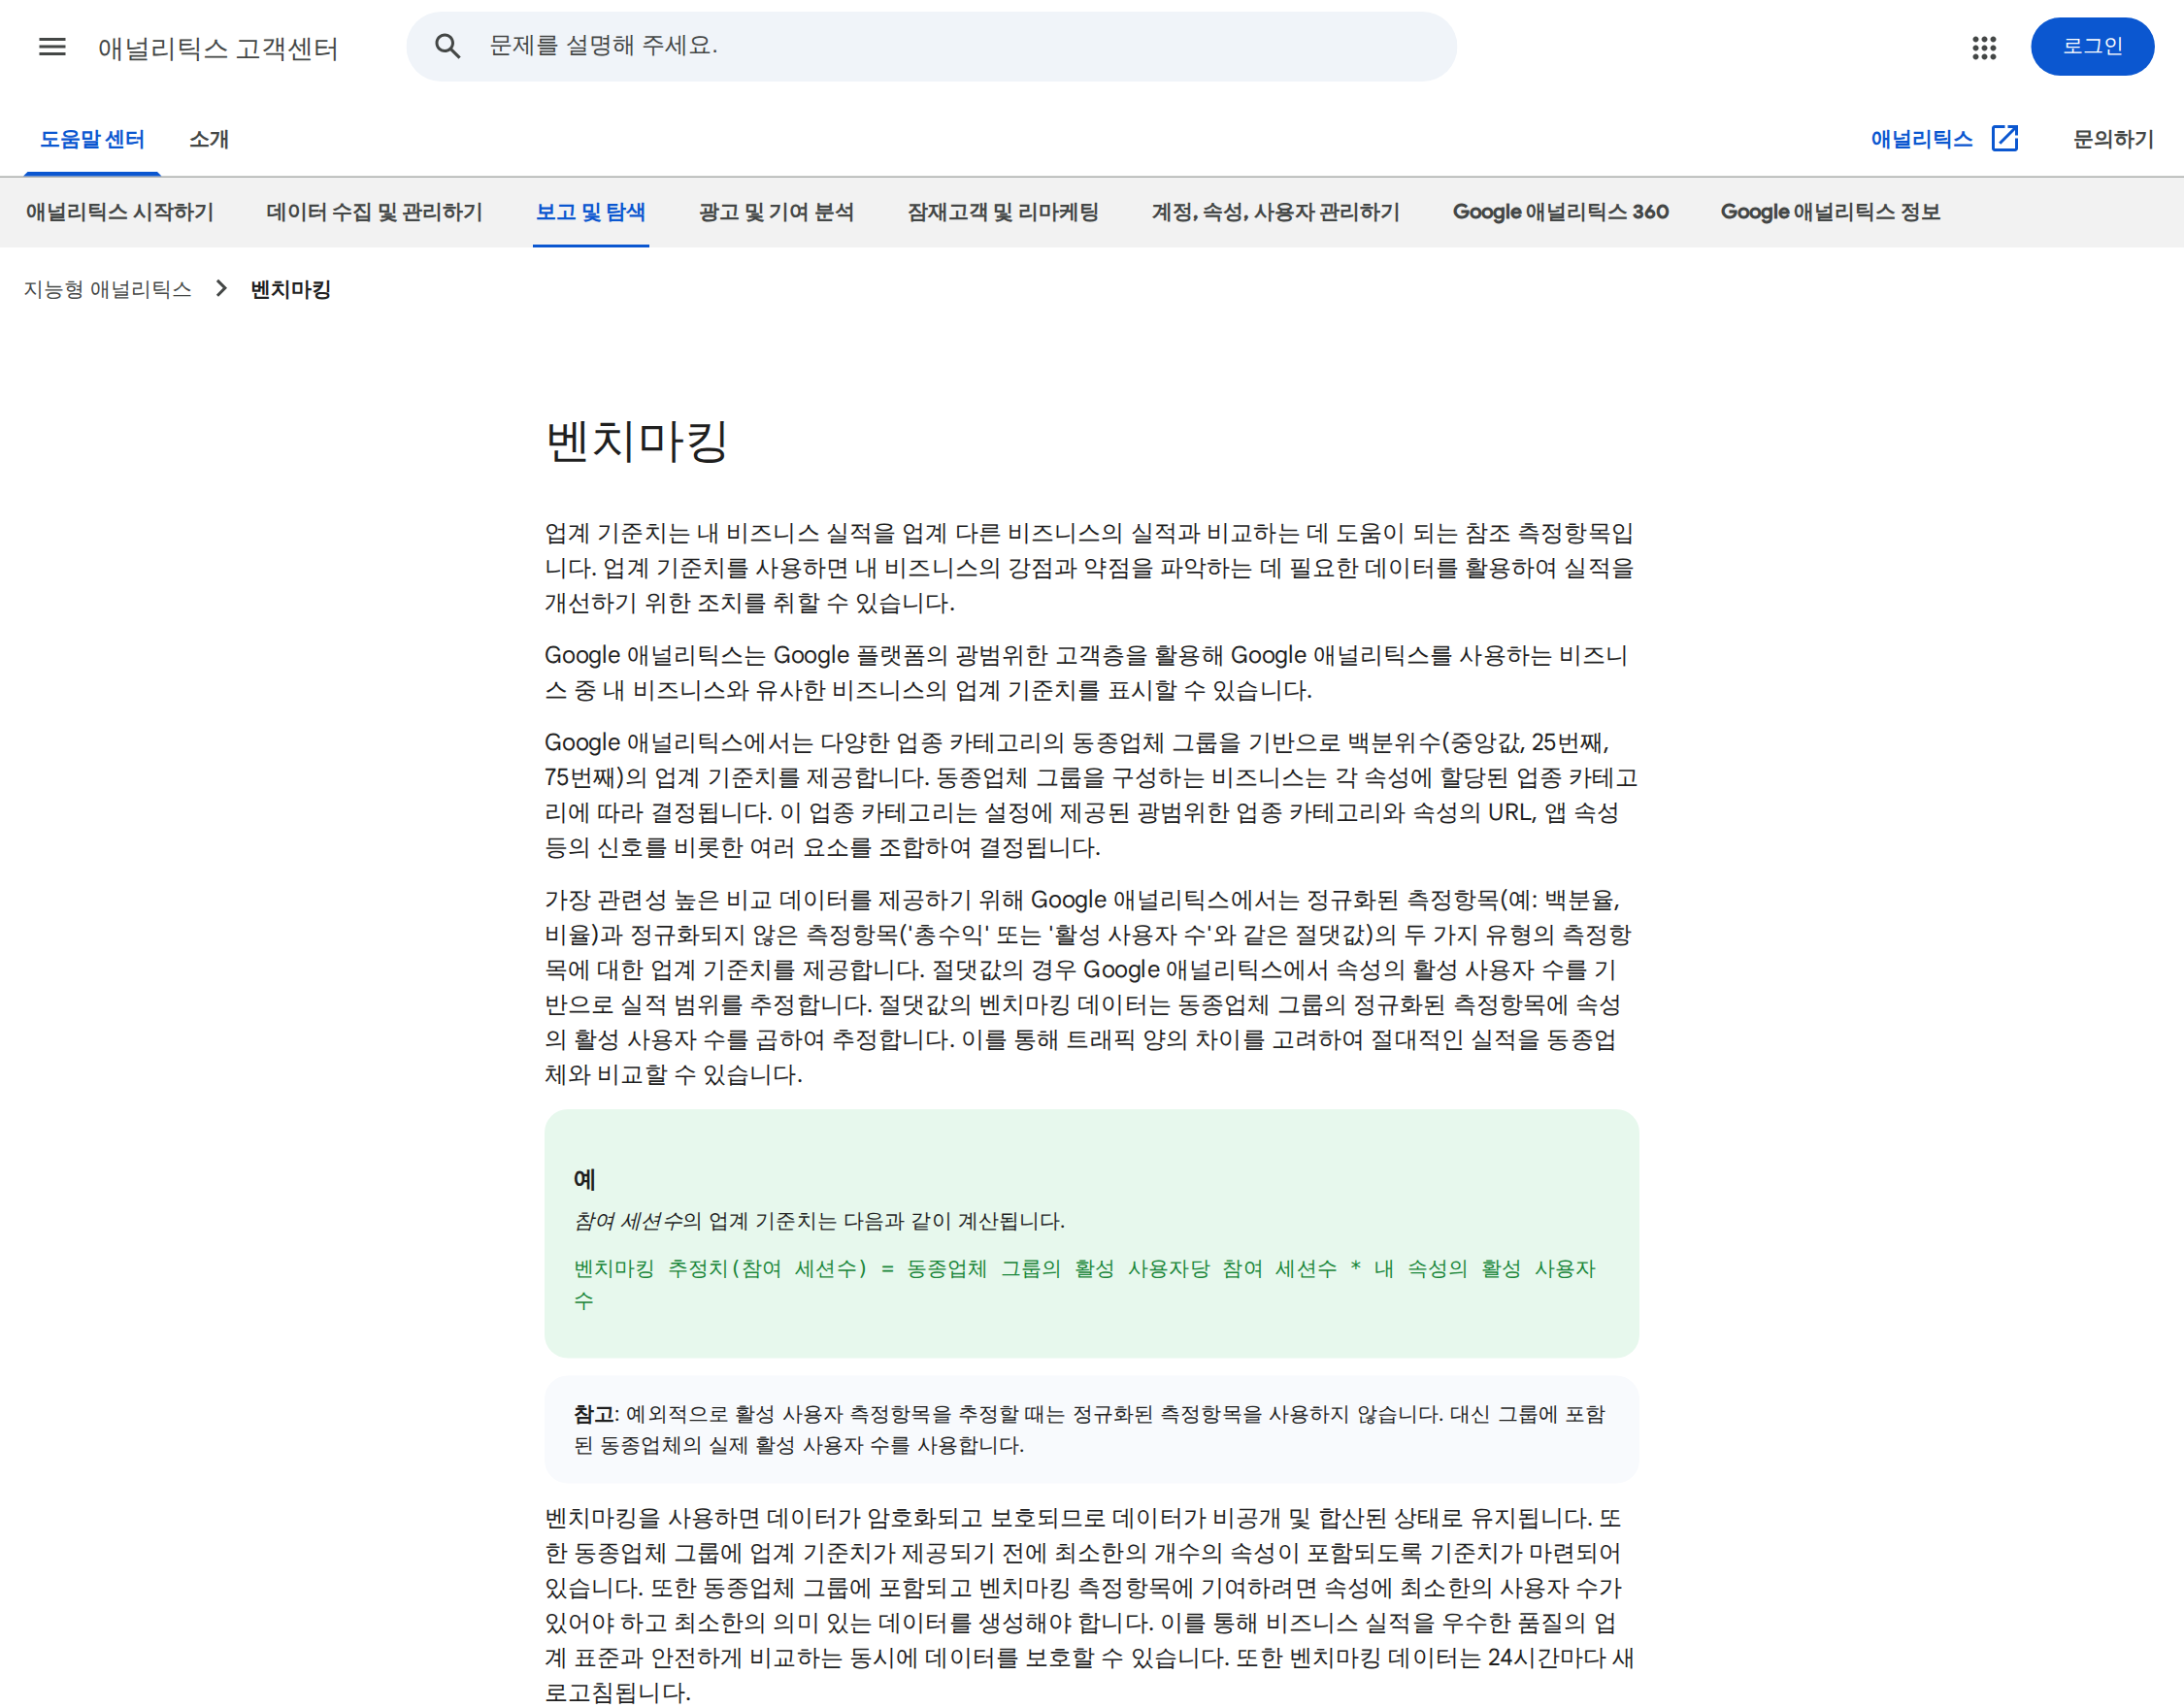
The help screen describes two kinds of metrics. Normalized metrics such as percentages and ratios are compared as they are. Absolute values such as "total revenue" or "engaged sessions" are estimated by multiplying the peer group's value per active user by your property's number of active users. For example, the estimate for engaged sessions is the peer group's engaged sessions per active user multiplied by your active users.
Here are the steps to turn benchmarking on.
- In GA4, go to Admin > Account settings for the property and enable "Engagement modeling and business insights." The Help Center lists this setting as a prerequisite for using benchmarking data.
- Open a standard report such as Reports > Life cycle > Acquisition > Acquisition overview, or the home page overview. You can see it in the acquisition, engagement, monetization and retention reports and in the home page overview.
- Click the benchmarking badge (or the conversion option) on a metric card to turn on benchmarking data for that card. Once on, the card shows your trend line (solid), the peer group median (dotted) and the group range (shaded).
You can confirm success by checking whether the dotted line and shaded area appear on the card. The Help Center also says where to look when they do not. If the date range is "Today," benchmarking data is unavailable, and the peer group needs a minimum number of properties before baselines are provided. Your own property also needs a minimum number of users and meaningful data to be included in the group. The Help Center does not state the exact numbers for these minimums. Data refreshes every 24 hours.
The Help Center's example scenarios show how to read the numbers. In the travel and transportation industry, for example, a bounce rate far above the median suggests you could check the user experience and landing pages. Here is a practice case with made-up numbers. Say your site's bounce rate is 62%, the industry median is 48% and the 75th percentile is 58%. Your bounce rate is even higher than the 75th percentile, so you are in the worst quarter of peers for bounces. All this tells you is that a gap exists. To find the cause, check candidates one by one, such as landing page speed, a mismatch between ads and page content, and mobile screens. To go on to bounce and retention metrics, see how to calculate retention rate and where to find GA4 retention.
Benchmarking competitor ads with the Ads Transparency Center and Meta Ad Library
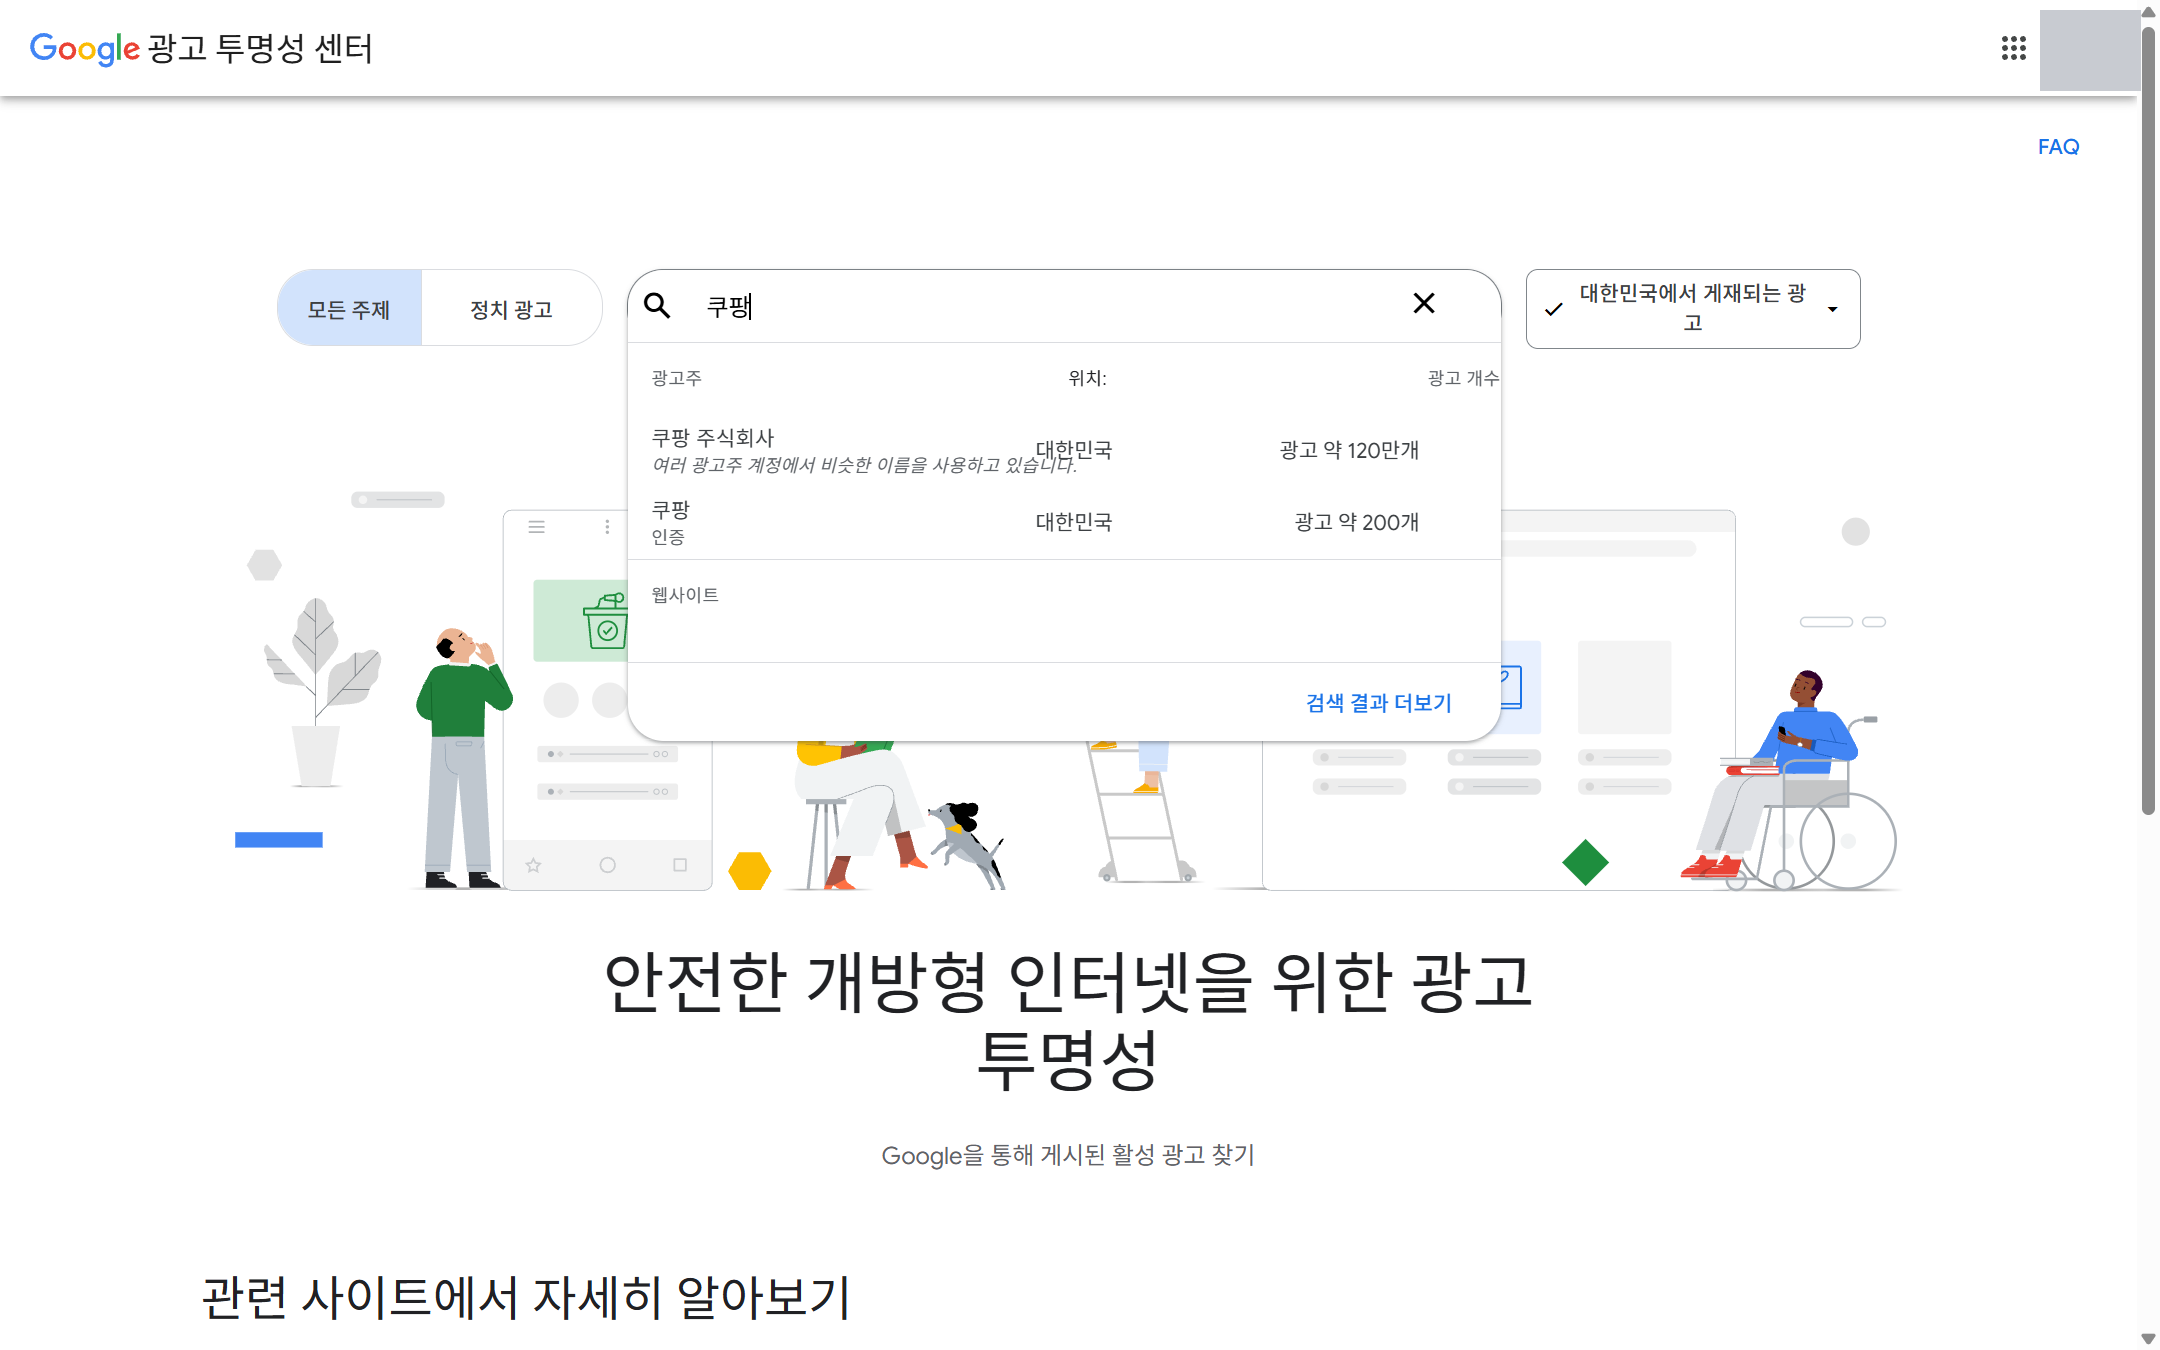
The Google Ads Transparency Center is a public site that shows who an advertiser is and which ads they run. You search by advertiser name or website without logging in. When I opened it and searched "Coupang" (a major Korean e-commerce company), advertiser candidates were listed with their region and ad count. On the November 14, 2026 screen, "Coupang Co., Ltd." showed South Korea with about 1.2 million ads, and a verified "Coupang" showed about 200 ads. A notice also appeared saying that several advertiser accounts with similar names and locations are grouped together.
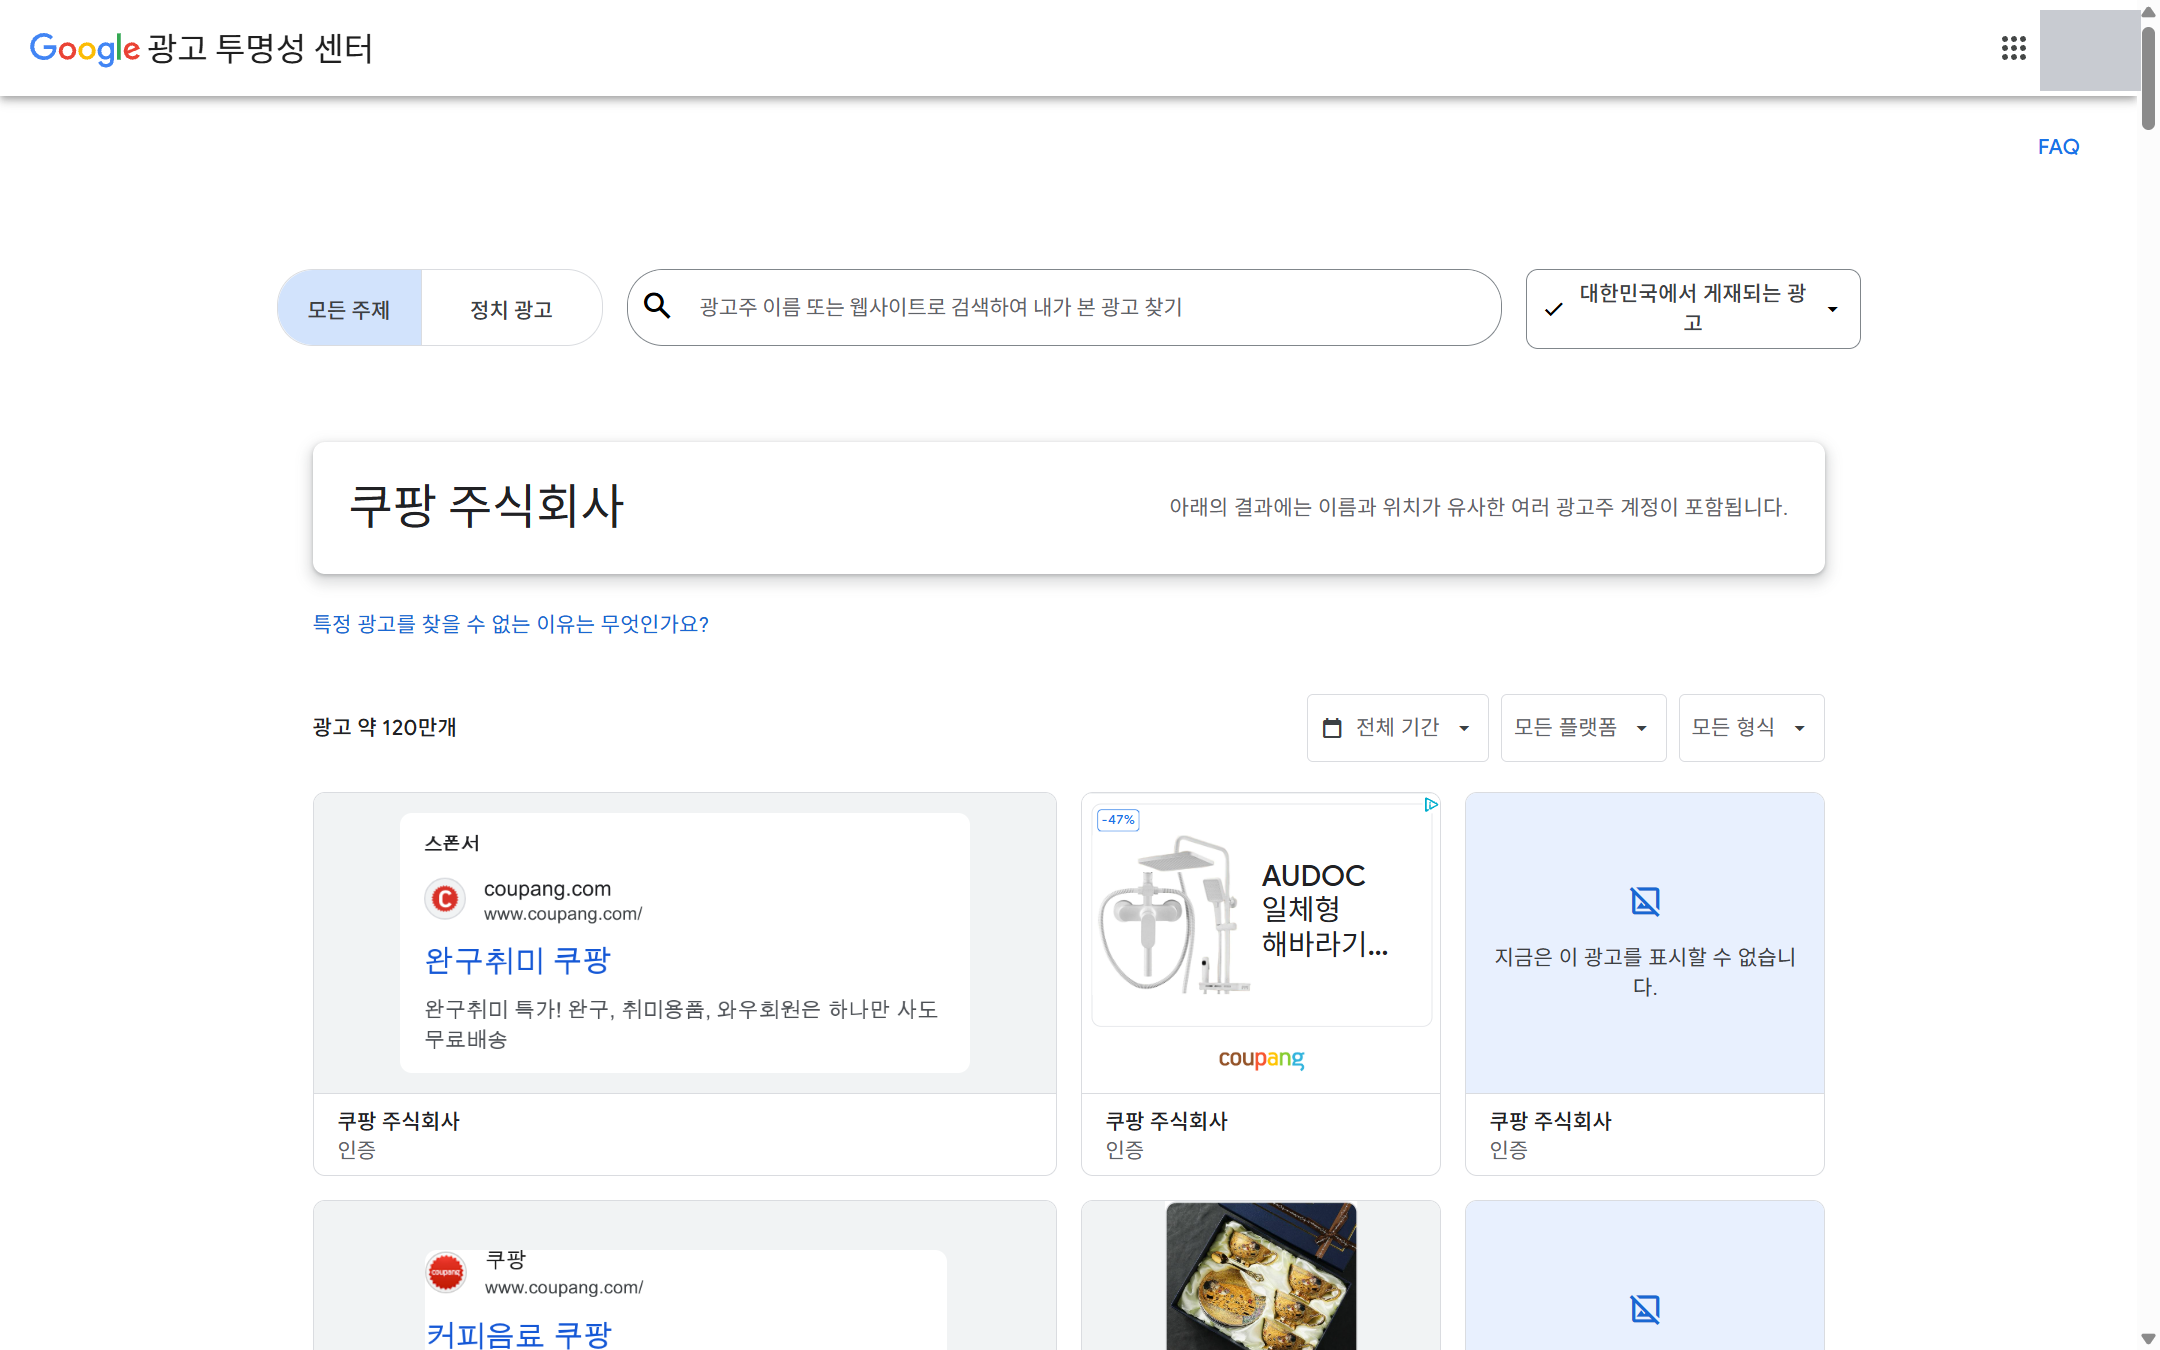
When you pick an advertiser, an ad list appears with filters for region, period, platform and ad format. On the same day, the filters started at South Korea, all time, all platforms and all formats. Ad cards showed a creative preview, the advertiser name and a verification badge, and some cards were replaced by the notice "This ad cannot be shown right now." Opening an ad showed the advertiser, region, last shown date, format and creative on the detail screen. I could not find ad spend or targeting information on the detail screen.
The scope and time lag are set by the Ads Transparency Center FAQ. Ads that a verified advertiser ran on Google Search, Play, Maps, Shopping and YouTube are included for 1 year from the last shown date, and it can take 48 to 72 hours for information to appear after an ad runs. Spend is not provided for ordinary commercial ads. So this screen tells you what message a company is running now, not how much it spends.
You view Meta (Facebook and Instagram) ads in the Ad Library. According to the Meta Help Center, you can see active ads running on Meta technologies together with their creative and text, the page running them and the start date. Spend is not shown for ordinary active ads, while spend information is provided for ads about social issues, elections and politics. The filter layout can vary by search screen and region. Search methods and how to read each screen are covered in how to use the Meta Ad Library.
Marketing benchmarking in 5 steps: finish with one comparison table
The 5 steps below are a proposal trimmed so you can finish in a day with the tools above. One question, a few comparison targets and one comparison table are enough.
- Pick one question. Write it at a size you can answer, such as "why is our landing page bounce rate high?" If you go broad, like "competitor analysis," you only pile up data.
- Choose about 3 comparison targets. Pick companies that sell to the same customers at a similar price level. Include only one industry leader and fill the rest with companies close to your size.
- Collect data on the same items. Take numbers from the GA4 benchmarking card, and ad messages and formats from the Ads Transparency Center and the Ad Library, and write them in the same cells.
- Write the difference and the reason, one line each. Separate facts from guessed reasons, as in "All 3 competitors put delivery time in the first line. We put price."
- Decide one thing to change as an experiment. Pick just one of the differences, A/B test it for 2 weeks, and measure the result again with the same metric.
| Item | Us | Competitor A | Competitor B | Question from the difference |
|---|---|---|---|---|
| First-line ad message | "Lowest price guaranteed" | "Arrives tomorrow" | "Free exchanges" | Do customers look at delivery and exchanges before price? |
| Ad format | 1 image type | Image and video | Image and video | Is there a reason we have no video creative? |
| Site bounce rate (vs. industry median 48%) | 62% | Unknown | Unknown | The comparison line only gives industry group numbers |
The "Unknown" cells matter in this example. GA4 does not tell you a competitor's site numbers, so do not force them in. Compare only the cells you can know, which are ad message and format. If you get stuck on how to organize the results persuasively, use the how to write a SWOT analysis guide alongside it, which sorts strengths and weaknesses first within the same frame.
Benchmarking goes wrong in three cases
| Wrong action | Resulting problem | How to fix it |
|---|---|---|
| Copying the methods of a company of a very different size | Budget and organization differ, so you do not get the same result | Include more comparison targets close to your size |
| Guessing ad spend and performance from the ad creative | The Ads Transparency Center and Meta Ad Library do not show spend on ordinary ads, so the conclusion has no basis | Compare only message and format, and check performance with your own experiment |
| Comparing but never changing anything | Tables pile up and the metrics do not move | Set one experiment from step 5 together with a schedule |
Before you raise your ad budget based on benchmarking results, it is safer to calculate return on investment too. The formula is in what ROI means and how to calculate marketing ROI, and if you only look at revenue against ad spend, use what ROAS means and how to calculate it.
Benchmarking FAQ
How is benchmarking different from plagiarism?
As the Standard Korean Language Dictionary defines it, benchmarking is a strategy of closely analyzing management methods in order to catch up. Analyzing a method and adapting it to your situation is benchmarking. Taking someone else's ad copy or images as is is not benchmarking but imitation. Use creative you see in an ad library only to learn the message and structure.
What should I do if the dotted line does not appear on a GA4 benchmarking card?
First check that "Engagement modeling and business insights" is on under Admin > Account settings, and that the date range is not "Today." If it still does not appear, your property or the peer group may not meet the minimum conditions.
How do I start internal benchmarking?
The easiest way is to put last quarter's best-performing campaign and worst-performing campaign side by side on the same metric. Pick one thing that differed, such as creative, audience or budget, and change it this quarter.
Found this useful? Share it
Latest posts
Kakao Share Thumbnail Not Showing? Here's the Fix (JavaScript SDK 2025)
Learn why Kakao Share thumbnails don't appear even with a valid imageUrl, and fix it using scrapImage to convert your URL into a KAGE CDN URL. Step-by-step guide.
How to Generate CRM User Manuals in 20 Minutes with Claude Code Sub-Agents
Learn how Claude Code sub-agents can analyze your CRM codebase and auto-generate user manuals and visual guidebooks in just 20 minutes. See the real-world results.
GEO Generative Engine Optimization: The Complete 2025 AI Marketing Strategy Guide
Learn what GEO (Generative Engine Optimization) is, how it differs from traditional SEO, and discover 5 proven AI marketing strategies to get cited by AI search engines in 2025.
Related projects
Get new posts by email
Insights on marketing, analytics, and dev, delivered to your inbox.