

Retention is how many customers who first arrived still come back after a set period. When you express it as a percentage, it is called the retention rate. The retention rate formula is simple. If 30 of 100 new customers return 7 days later, 7-day retention is 30%. Unlike acquisition, which is about bringing people in with ads, retention shows whether those people stay. That is why you check it when judging whether your ad spend is worth it.
Use this retention rate formula: "people who came back on a given day ÷ people who first arrived."
Even "7-day retention" changes depending on whether you count "exactly day 7" or "at least once on or after day 7," so align the definition first when you compare numbers.
In GA4, the Retention overview report in the Life cycle collection shows retention on day 1, day 7 and day 30.
Retention rate formula: an example with 200 new customers
To apply the retention rate formula, fix the denominator as "people who first arrived (new customers)" and change the numerator to "people who came back after N days." If you set the first-visit day as day 0, you get one rate for each reference day, such as 1 day, 7 days and 30 days later. The numbers below are an example to show the method.
| Reference | Returning people | Calculation | Retention rate |
|---|---|---|---|
| Day 0 (first visit) | 200 people | 200 ÷ 200 | 100% |
| After 1 day | 62 people | 62 ÷ 200 | 31% |
| After 7 days | 30 people | 30 ÷ 200 | 15% |
| After 30 days | 14 people | 14 ÷ 200 | 7% |
The key point is that the denominator stays at the original 200. If you divide the 30 people from day 7 by the 62 people from day 1, you get a different number (about 48%). That is the share who continued to a second visit, not 7-day retention.
| Reference day | Retention rate |
|---|---|
| Day 0 | 100 |
| Day 1 | 31 |
| Day 7 | 15 |
| Day 30 | 7 |
The curve usually drops most steeply in the first few days. If the rate after the first day is low, the experience right after signup or the first purchase is likely the problem. If the curve flattens at some level, that level is your steady base of loyal customers. Reading the shape of the curve is more useful than reading a single number.
N-day, range and unbounded retention differ in how they count
Different calculations share the same name, "7-day retention." The calculation method guide from Airbridge, a mobile app analytics tool, defines N-day retention as "the share of users with a start event who performed a return event on day N." In practice, variants are also used: counting any day within a range, or at least once on or after day N. Names and definitions differ by tool, so check the report's documentation. If you compare numbers without checking the method, you end up comparing different things.
| Method | What it counts | Best for |
|---|---|---|
| N-day retention | People who return exactly N days after their first visit | Daily-use apps, checking onboarding impact right after signup |
| Range retention | People who return on any day within a set range (for example, days 6 to 8) | Services where visits vary by day of the week |
| Unbounded retention | People who return at least once on day N or later | Services with long return cycles, long-term usage patterns |
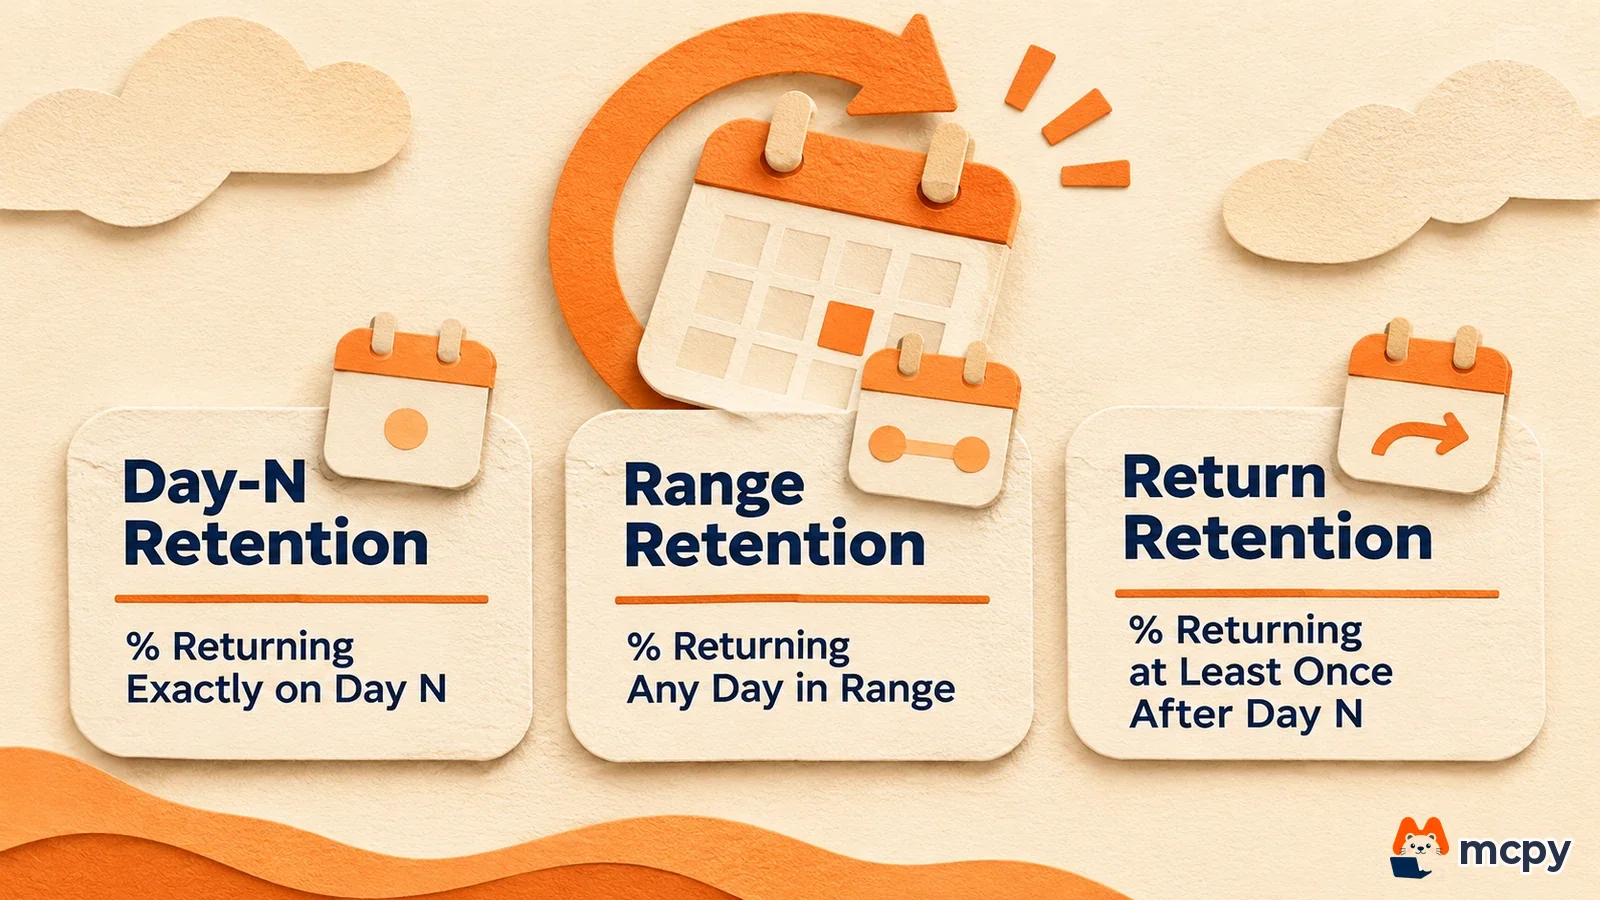
The same 200 people give different values depending on the method. Suppose 30 people returned exactly on day 7, 38 returned on any day from day 6 to 8, and 48 returned at least once on or after day 7. The result looks like this (illustrative numbers).
| Method | Retention rate |
|---|---|
| Exactly day 7 | 15 |
| Days 6 to 8 range | 19 |
| At least once on or after day 7 | 24 |
"On or after day 7" also includes people who return beyond the range, so it is equal to or higher than the other two methods. To judge the effect of an ad campaign or an onboarding change, N-day retention is easier to compare by date. For a service people use once a month, range or unbounded retention is closer to reality.
Retention rate differs from churn rate and repurchase rate
Churn rate is the share who left, so it adds up to 100% with the retention rate of the same period. If 7-day retention is 15%, 7-day churn counted with the same definition is 85%. However, according to Google's help documentation, GA4 bounce rate is a separate metric, "the percentage of sessions that were not engaged," so do not read it as the opposite of retention.
Repurchase rate is close to a shop version of retention. It counts a "purchase," not a visit, as the returning action. In a business where customers buy once and leave, visit retention can be high while the repurchase rate is low. So decide the core action of your business first (revisit, repurchase or repayment) and count retention by that action. The higher the retention, the more value one customer creates over time, which raises LTV (lifetime value) and lets you recover the CAC, the cost of acquiring a new customer, over a longer period.
Where to find the retention rate in GA4
According to Google's help documentation, the Retention overview report is in the Life cycle report collection. It shows in one screen how many users stay over time and the lifetime value of users. If the report is missing from the left menu, a user with Editor permission or higher can add it back. The overview report guide explains that an overview report is a screen that gathers summary cards from other reports.
| Card | What it shows |
|---|---|
| New users and returning users | The number of users who visited for the first time and users who visited at least once before |
| User retention by cohort | The share of each acquisition-date cohort that returned after 1, 7 and 30 days |
| User engagement by cohort | Average engagement time of each acquisition-date cohort on day 1, 7 and 30 |
| User retention | The share of users who return each day during the first 42 days (starting at 100% on the first visit) |
| User engagement | Average engagement time of users who returned during the first 42 days |
| Lifetime value | Average revenue generated by new users during the first 120 days |
Here, a cohort is a group of users bundled by the same criterion, such as users who first arrived on the same day. To compare each signup week separately or to set your own inclusion criteria, you need cohort exploration in the Explore feature. The steps are in how to do GA4 cohort analysis.
The check itself is simple. In the Retention overview, look at how far the user retention curve drops in the first few days and from which day it flattens. Compare these values before and after you change an ad campaign, or by the channel that brought in the new users. Only then can you say whether things improved. If you look at one total number, good and bad channels blend together in the average and stay hidden.
Steps to calculate your own retention rate and verify it
Before you trust the GA4 card numbers, calculate once by hand on a small sample. It builds a feel for the definition and shows whether the card values are right. You only need a spreadsheet and a list of signups (or orders).
- Pick one week to analyze. Select only the people who first signed up or first purchased that week and count them. This number is the denominator.
- From their later visit or purchase records, calculate each person's "day 7 from the first day" date.
- Count the people with a record on day 7. This number is the numerator, and numerator ÷ denominator is 7-day retention.
- Find day 1 and day 30 the same way, then connect the three points like the curve above.
- In the User retention by cohort card of the GA4 Retention overview, find the value for the same period and compare. GA4 is visit-based, so if your list is purchase or signup-based, different values are normal. If they still differ a lot after you match the same action, suspect differences in date criteria or user identification first.
The success criterion is not a pretty number. It is reproducing "how many people remain by which day" with the same definition at least twice. If one week's sample is a few dozen people or fewer, the rate swings a lot from a few people, so collect 4 weeks or more and read the average trend. This step structure and these criteria are the author's practical judgment, not a procedure defined by Google's help documentation.
When retention is low, fix these areas first
The checking order by curve shape is the author's judgment. Where the curve drops matters more than the fact that the value is low, because it points to the cause. Below are the first places to suspect for each curve shape.
| Curve shape | Where to check first |
|---|---|
| Big drop after day 1 | Guidance right after signup or first purchase, and the number of steps before the user feels value in first use |
| Another drop around day 7 | The reason to return after the first week (the timing of re-contact in CRM messages such as Kakao Alimtalk, Korea's business messaging channel, or email) |
| Large differences by channel | Whether the ad creative and landing page of the low-retention channel match what the service is really like |
| Flattens at a low level | The reason to reuse the core feature or product itself |
Change one thing at a time. For example, if you changed the message right after signup, compare only day 1 retention of the 4-week cohort before the change and the 4-week cohort after it. If you change the message and the price together, you cannot tell which one moved the value. Repeating small experiments and keeping only the methods confirmed by numbers matches the basic sequence of growth hacking.
Retention rate formula FAQ
What is a good retention rate?
The benchmark varies a lot by industry and type of service, so it is hard to give one number. A daily-use app and a once-a-month service have different normal ranges. First compare with your own past cohorts and see whether the rate is rising or falling.
Are retention and conversion rate (CVR) the same metric?
They are different metrics. Conversion rate is the share of visitors who took a target action, and retention is the share of first-time arrivals who come back later. The difference in the conversion rate denominator is covered in CVR meaning and how to calculate conversion rate.
What if I can't see the Retention overview report in GA4?
According to Google's help documentation, a user with Editor permission or higher can add the report back to the left navigation menu. If you don't have permission, ask someone who has Editor permission.
Found this useful? Share it
Latest posts
Kakao Share Thumbnail Not Showing? Here's the Fix (JavaScript SDK 2025)
Learn why Kakao Share thumbnails don't appear even with a valid imageUrl, and fix it using scrapImage to convert your URL into a KAGE CDN URL. Step-by-step guide.
How to Generate CRM User Manuals in 20 Minutes with Claude Code Sub-Agents
Learn how Claude Code sub-agents can analyze your CRM codebase and auto-generate user manuals and visual guidebooks in just 20 minutes. See the real-world results.
GEO Generative Engine Optimization: The Complete 2025 AI Marketing Strategy Guide
Learn what GEO (Generative Engine Optimization) is, how it differs from traditional SEO, and discover 5 proven AI marketing strategies to get cited by AI search engines in 2025.
Related projects
Get new posts by email
Insights on marketing, analytics, and dev, delivered to your inbox.